C-Store Valuations
|
Canadian Markets
|

|
Enter subhead content here The Convenience Channel Market
Report Canada Q2, 2009
According to the Canadian Convenience Stores Association, the Canadian Convenience Industry includes over 23,000 retail locations and, excluding automobiles, represents 8.6% of the total retail economy; the fifth highest category. One in every three Canadians patronizes a convenience store every day. Convenience stores with gasoline (NAICS 44711) sell an annual average of $3.2 million in motor fuel and $820,000.00 in merchandise per site. VALUATION In the sections below, we will examine three important trends: VALUE OF CONVENIENCE STORES 1. Demographics Driving Demand in the Convenience Channel 2. National and Regional Economic Performance 3. Major Challenges to the Convenience Industry APPRAISAL Over time, the economic performance of all local retail markets move toward the national industry averages. So, the economic trends for the industry as a whole reflect the long-term health of the subject property. APPRAISAL
The low growth of the Canadian population is well documented. The retail economy is especially dependent on demographics. Population growth and personal income are the two most important components of retail demand. The Canadian population grew by 5% during the 5-year period between 2002 and 2007, or an average of 1% per year. However, the growth was uneven across the provinces. The Maritimes generally lost population while Alberta and the Yukon Territory grew because of economic expansion and Ontario and British Columbia grew because of immigration. VALUATION OF CONVENIENCE STORES Canada’s population is projected to grow by 4% between 2007 and 2011, with Ontario experiencing a higher than average increase of 5% during this period. EVALUATION OF CONVENIENCE STORES Consumer spending growth was high in 2007 and 2008 (4.5% and 3.4, respectively), but this rate of growth has dropped sharply in 2009 and is expected to remain much lower to 2010. Debt as a ratio to personal income has been increasing in recent years and the savings rate is much lower. EVALUATION OF CONVENIENCE STORES Total growth in spending was 14% between 2002 and 2007, of which 11.5% was due to inflations and 5% due to population growth. It is apparent that except for alcohol and personal care/health care products, other product categories seem to have reached a stage of maturity. While spending on food has grown at the same rate as inflation, spending on tobacco and lotteries has declined sharply. For a number of products on which stores depend for growth and profitability, household spending is stagnating or shrinking. APPRAISAL Unemployment is forecast at 7.8% in 2010, higher than the 6% level in 2006. Inflation is expected to remain about the same, at 2.3% in 2010. APPRAISAL In summary, the overall demographic trends in population growth and personal income indicate a challenging long-term economic environment for the convenience industry. Slow population growth and reduced personal spending will likely cause more consolidation in the convenience industry and reduce average net profits per store. We will examine economic performance in the next section.
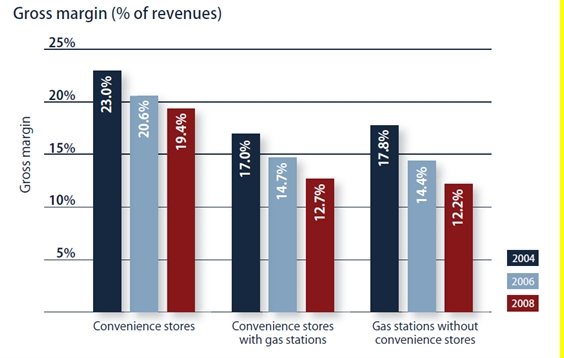
In the 2006-2007 expansionary period, retail sales in Canada were largely driven by residential development (construction, renovation and household appliances). With current slowdown in manufacturing and weaker job creation, the data suggest than 2009 and 2010 retail sales will be much slower. In 2008, the national average growth in retail sales was 3.4%. With an underlying inflation rate of 3.3%, this essentially means no real growth in retail sales occurred in 2008. For the past several years, the Western Provinces have outperformed the rest of the country. Saskatchewan and Alberta experienced double-digit growth rates in retail sales in 2006-2007 and consistently higher growth rates in the previous decade. Ontario’s retail sales growth rate has tracked with the national average. Growth in convenience industry sales were forecast at 8.9% in 2008, after a 10.1% growth rate in 2007. However, most of this increase is due to increases in the price of gasoline. The quantities of gasoline sold have actually decreased. APPRAISAL Across the nation, convenience store sales per establishment averaged $1,756,024.00 in 2008. Higher numbers are reported in the western provinces where the number of persons per store is higher. Ontario reported sales per establishment of $1,725,056.00, nearly identical to the national average. VALUATION Convenience stores without gasoline sell on average $700,000.00 in merchandise, while convenience stores with gasoline sell $820,000.00. The attraction of gasoline is estimated to account for 20% to 30% of sales and customer traffic. With gasoline totaling $3.2 million in 2008, the total per site sales in 2008 were $4.1 million. EVALUATION With 23,435 store locations across Canada, the geographic distribution of stores closely follows the population totals. For example, Ontario and Quebec account for 62% of Canada’s population and have 63% of the total convenience stores. The average store-to-population ratio is 1: 1,417. Ontario closely follows the national average with one store for every 1,443 persons. In contrast, the West has fewer stores. Alberta, for example, has only one store for every 2,157 persons. So, industry growth opportunities are greater in the West than other areas of the country and stores in the West are achieving higher sales and profits than stores in the Maritimes. EVALUATION The average store size is 147 square meters. The average rent paid per store is $21,335.00 per year. GAS STATION APPRAISAL Sales per square meter of store area averaged $5,620.00 in 2008. Gasoline accounts for about 72% of total sales for those stores that sell gasoline. While tobacco, lotteries and beverages (excluding milk) account for the three largest merchandise sales categories, the three categories of tobacco, beverages and confectionary account for 45.2%, or nearly half, of profitability. These products that contribute most to profitability are declining or only growing slightly. To offset this decline, stores today must expand by offering food service, or other products and services. GAS STATION EVALUATIONS Gross margins for convenience stores with gasoline have been declining since 2004. As shown in Figure 1 below, gross margins for convenience stores with gas stations was 17% in 2004, 14.7% in 20066, and 12.7% in 2008. The average gross profit per store was $66,129.00 in 2008. GAS STATION EVALUATIO GAS STATION APPRAISAL FIGURE 1 Convenience Industry Gross Margins in Canada: 2004, 2006 and 2008
Graphic
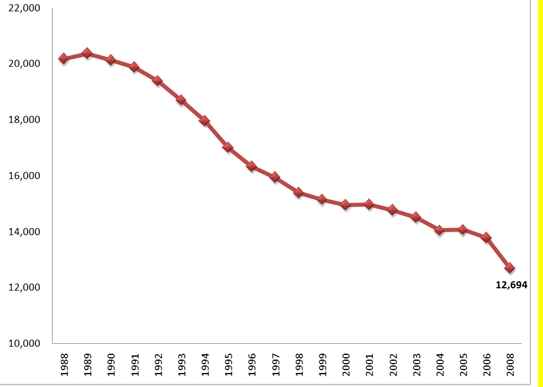
Source: Canadian Convenience Store Association XXX Net margins have experienced a decline also; 1.0% in 2004, 0.9% in 2006, and 0.9% in 2008. However, the decline is not as pronounced as that of gross margins. The reason for this is the increasing number of self-serve installations and point-of-sale (POS) technology which has reduced labor expenses. Labor expense is the single-largest operating expense. In 2002, labor accounted for 79 of sales, and in 2006 was reduced to 6.1% of sales. XXX According to M.J. Ervin & Associates, throughput efficiency averaged 3.11 million litres per year per site. The highest average throughput was in Ontario with 4.5 million litres per site while the lowest was the Yukon Territory with an average of 285,000 litres per year per site. The contrast between Ontario and Quebec is significant, with Quebec pumping only half the average volume of fuel per site as Ontario. Even within Ontario the difference in throughput between metro and rural areas can be striking. It is common for an outlet in Toronto to average 6-7 million litres per year, while a typical outlet in a small town might have an annual average 1-2 million litres. XXX The number of gas stations in Canada peaked in 1989 at 20,360. A steady decline has occurred since that time, averaging a loss of 2% per year, as shown in Figure 2 below. In 2008, 12,694 gas station locations were operating in Canada. This represents a 38% drop in number from 1989 to 2008. XXX XXX FIGURE 2 Number of Retail Gas Stations Operating in Canada: 1989-2008
The Canadian Convenience Store Association identifies three current issues as the most challenging for the industry. These three issues are: Illegal Sale of Tobacco, Cost of Credit Card Transactions, and Over-Regulation. AAA Tobacco accounts for 23% of the gross profit of a convenience store and has the largest impact on profitability. Illegal sales and smuggling of tobacco are thought to cost the average store a loss of in gross profits of $11,094.00 per year and a loss of 45 store visits. AAA Credit card transactions are growing in number and as the price of gasoline rises, the cost to the convenience store operator goes up. Credit card fees that the operator pays to the credit card companies, such as Visa and MasterCard, are based on a percentage of gross sales. When wholesale costs increase, the total credit card fees rise even though the gross profit often does not increase. This increased operating expense is reflected in lower net profits. Credit card fees are usually in the top three highest operating expense categories (labor, utilities, credit card fees) paid by the store operator. AAA The third major challenge facing the convenience industry is hyper-regulation. This applies to both national and local regulations, since each province adds its share of laws and regulations. In some cases, certain high-potential products such as beer and prepared food are prohibited in convenience stores, while allowed in competing retail channels. The convenience industry in Canada is also regulated by as to business hours, minimum employee levels and sales to minors. The convenience industry believes its sales potential and competitive position relative to other retail channels is limited by these regulations. AAA Every day one convenience store in Canada closes its doors. For non-growth markets, such as Ontario, Quebec and the Maritimes, the demographic trends and challenges for the convenience industry will preclude any substantial growth in sales and store profits over the next five years. |
|||||||||||||||||||||